Monitor Emissions
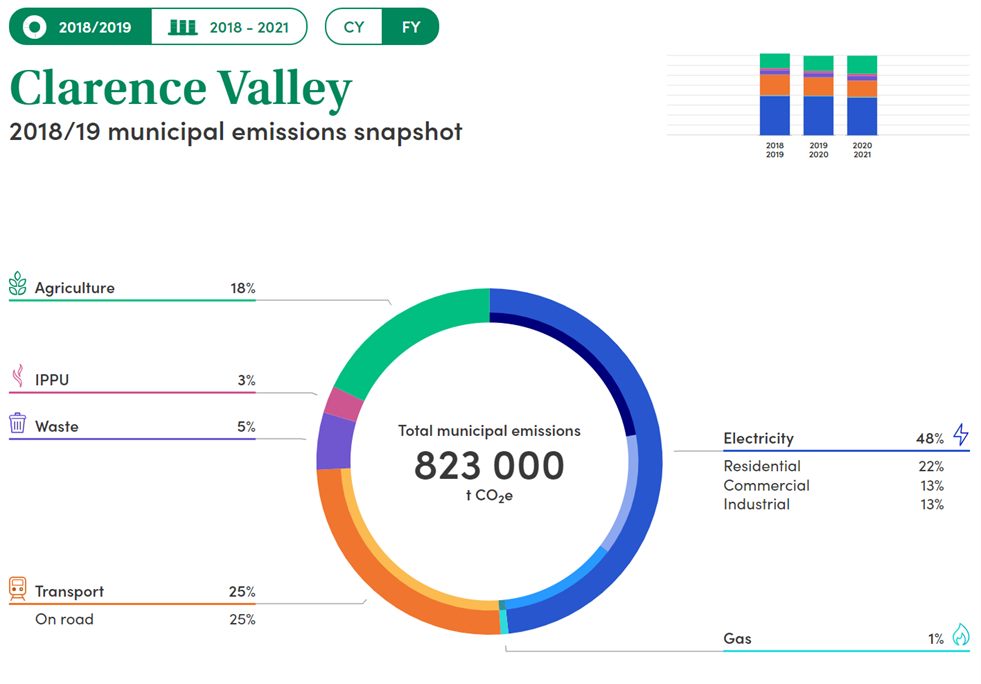
The Clarence Valley communities’ biggest sources of carbon emissions are energy consumption (electricity 48%), transport (25%) and agriculture (18%). Emissions data for Clarence Valley Council has been estimated by Snapshot.
Why not explore Clarence Valley’s emission sources yourself via snapshots user-friendly online tool?
